
-
Hey Guest👍👎 We're looking for reviews of your local CUPRA or SEAT Dealership - it's quick and easy to do: Leave a review now
You are using an out of date browser. It may not display this or other websites correctly.
You should upgrade or use an alternative browser.
You should upgrade or use an alternative browser.


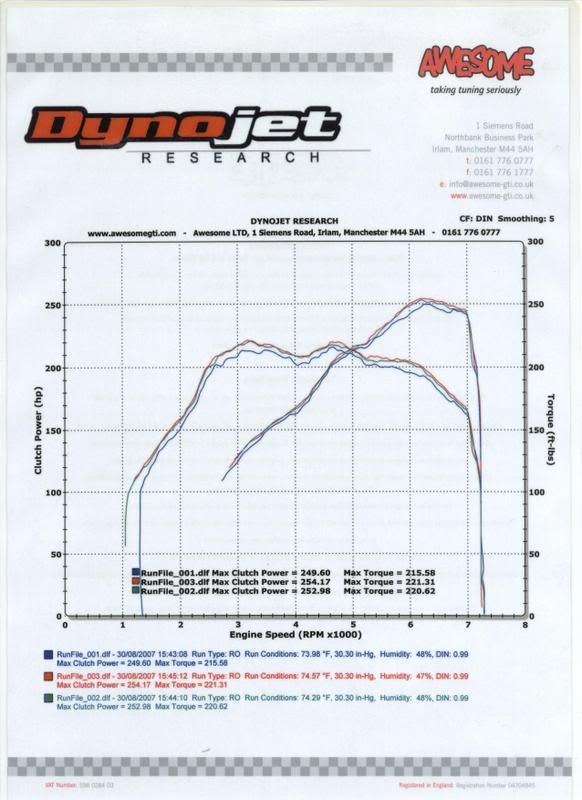
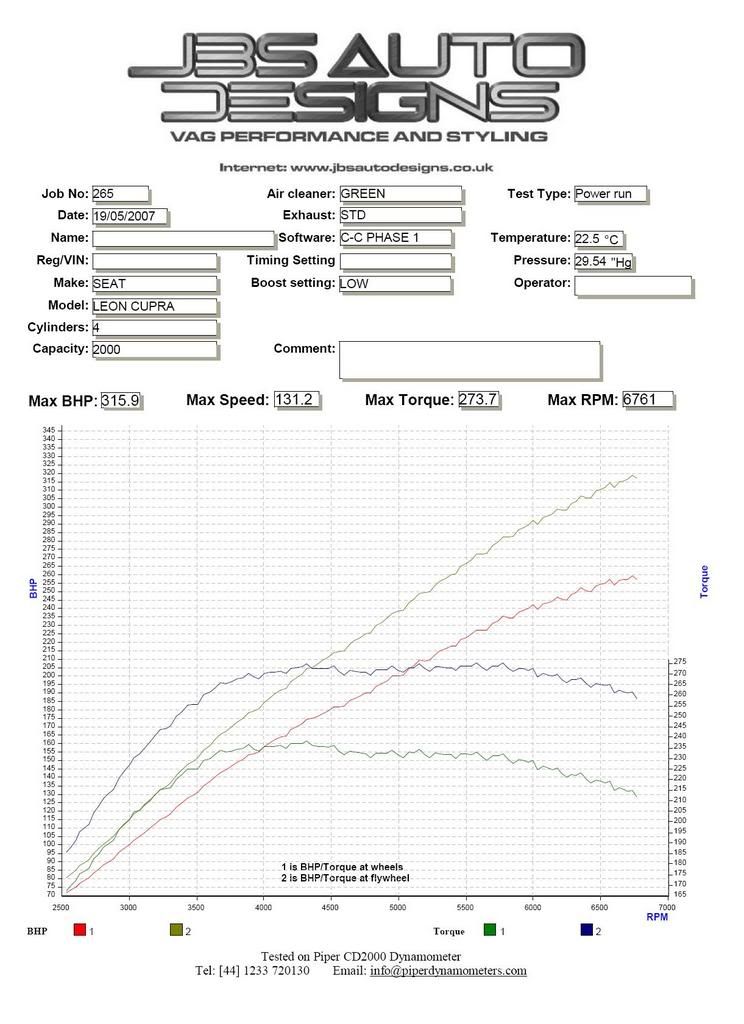
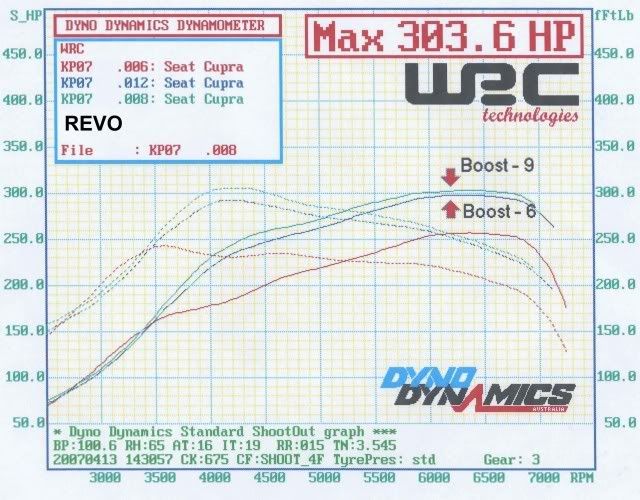
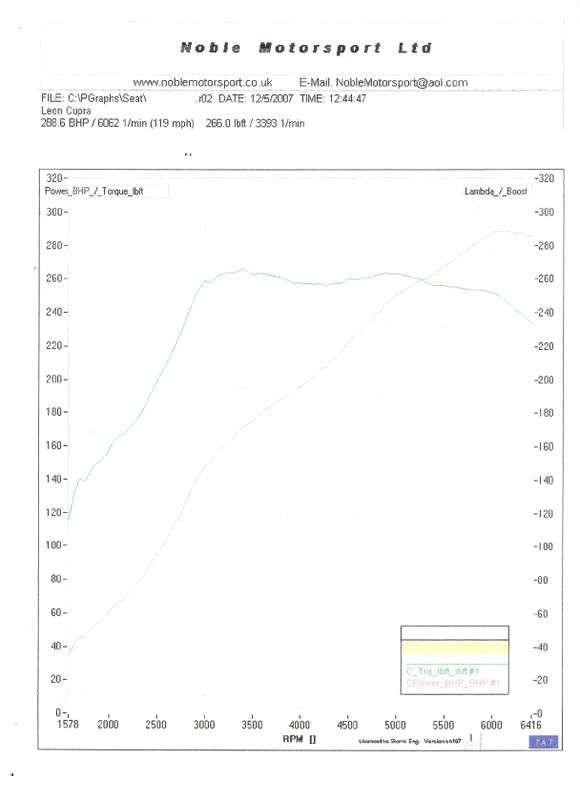
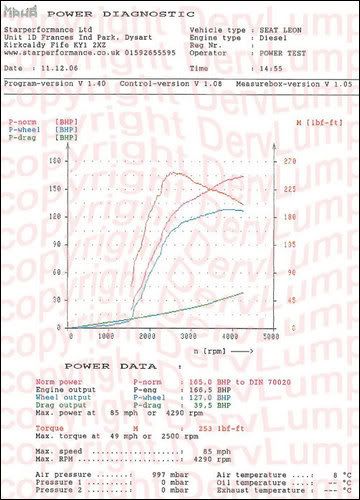
to the untrained eye, djhoraces' and zboyds' graphs are very similar.
they obviously look different but comparing the peaks and troughs to the axis values then they are close.
and both well over book power, zboyds 260 against a claimed 237, very nearly 10%!!
sorry i dont have one to contribute yet.
they obviously look different but comparing the peaks and troughs to the axis values then they are close.
and both well over book power, zboyds 260 against a claimed 237, very nearly 10%!!
sorry i dont have one to contribute yet.
CUPRA MK2 R
Guest
2.0 TDI Ref Sport (140ps) @10K Service
Twin exhaust is the only thing considered a mod i suppose..
Great post David
Cool 20ish HP up - wonder what my 170 is pushing out..........
noufinho
Guest
Hi every body!!
Sorry for my little level in english, i say you my power/torque graph after remap :
319 HP and 480 Nm
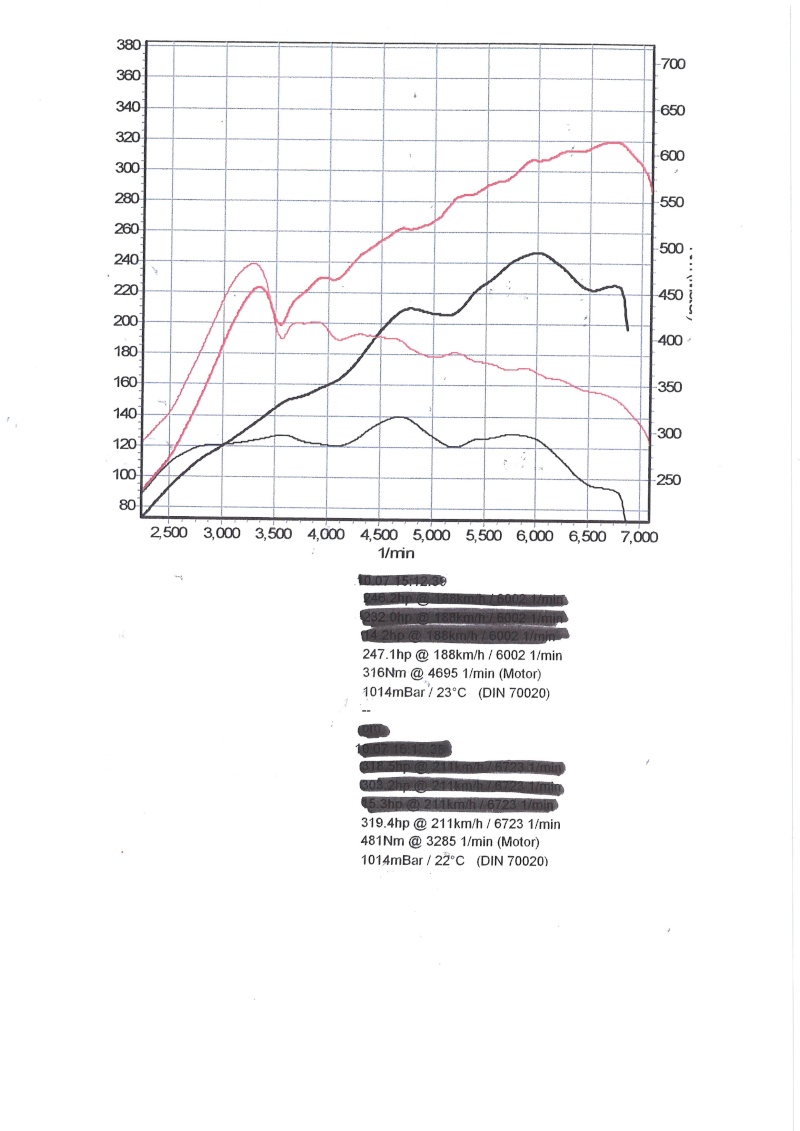
Sorry for my little level in english, i say you my power/torque graph after remap :
319 HP and 480 Nm
Cool 20ish HP up - wonder what my 170 is pushing out..........
Only one way to find out
")
![[B)]](/forums/styles/seatcupra/oldforumsmileys/shades.gif "Cool [B)]")

Similar threads
- Replies
- 9
- Views
- 1K